


 16 / 46

Poverty to Prosperity
Budget Presentation
Gordon House March 19, 2015
16
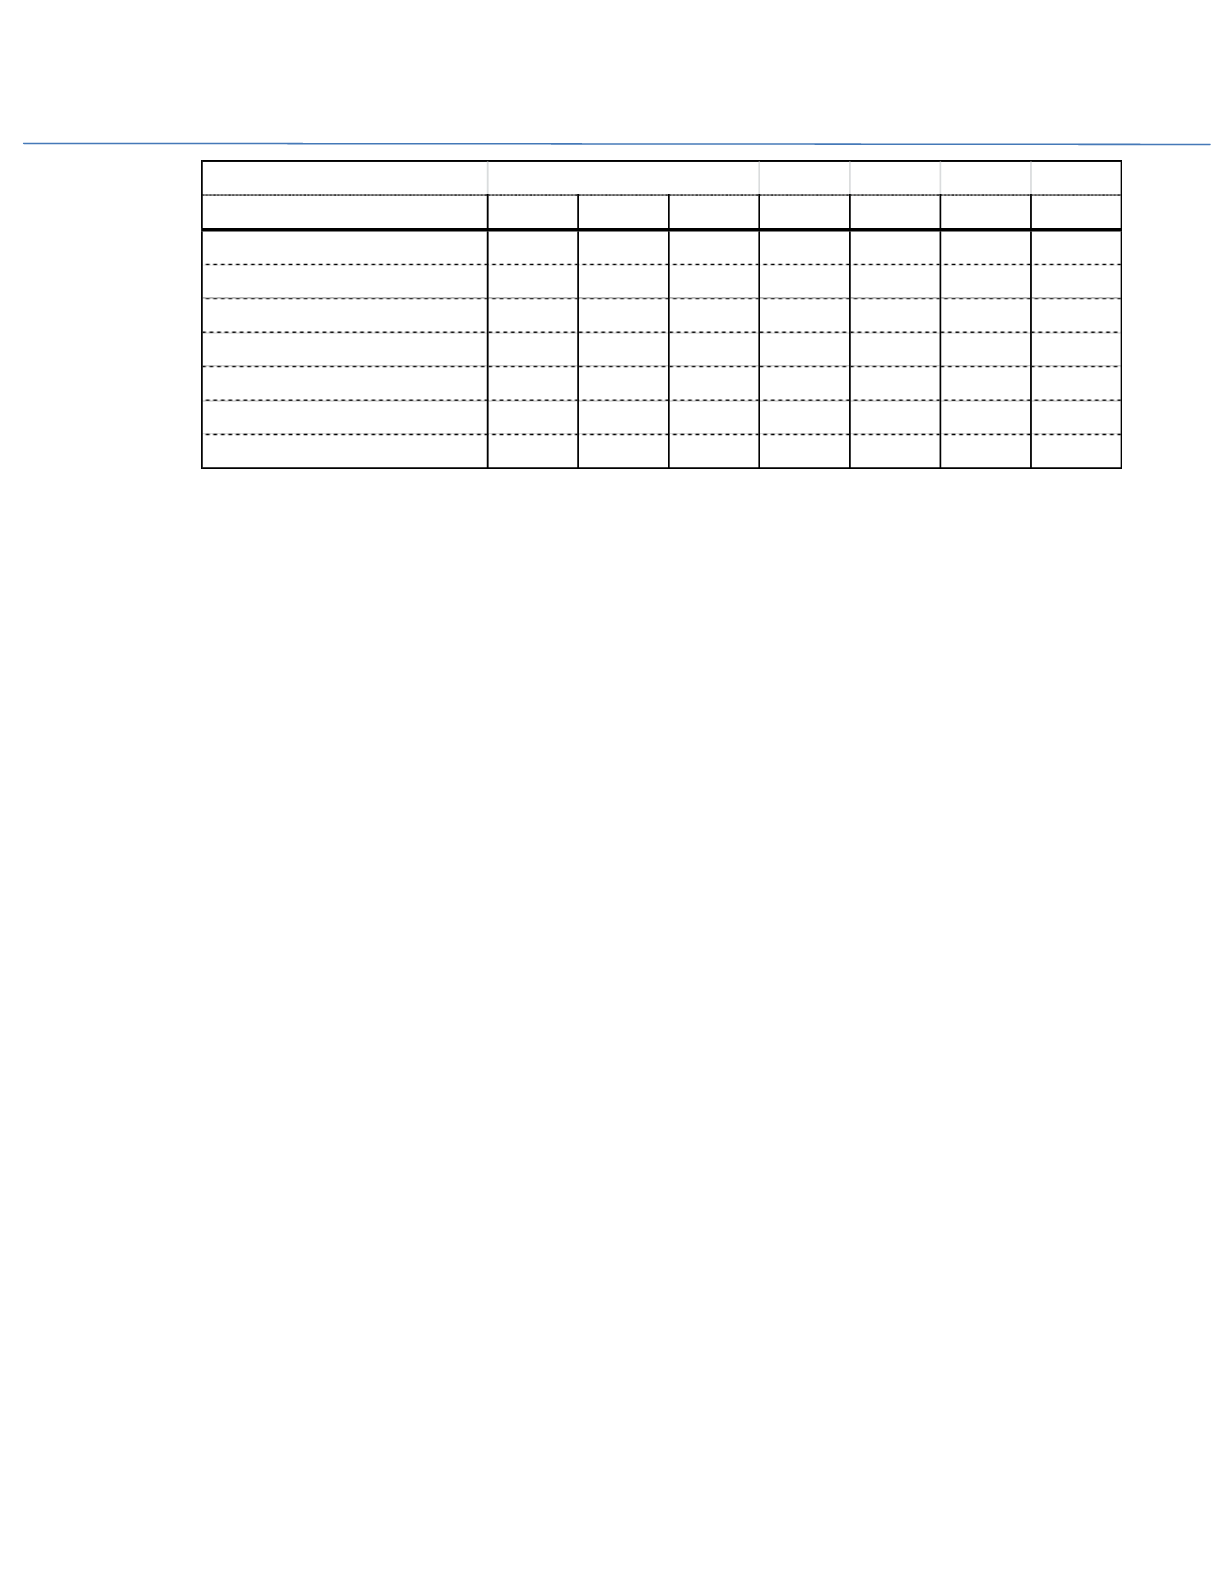
Demand for Tertiary Education
2006 2007 2007 2009 2010 2,011 2012
Students with 4+ CSEC passes
9,676 10,347 11,315 12,774 14,664 17,415
Tertiary Enrolment
65,872 61,140 64,034 68,471 68,993 74,601 74,413
Tertiary Cohort
209,214 207,494 207,993 208,500 208,500 253,273 257,264
Tertiary Gross Enrolment Rate % 31.5
29.5
30.8
32.8
33.1
29.5
28.9
Student Loan Applications
6632 6548 6585 9767 11796 12189 16471
Applications Approved
5365 6158 6468 8653 9947 12006 15576
Loan Value JA$Bill
0.81 0.927
0.85
1.8
1.6
3.2
4.5
We have to make up our minds about whether to increase the budgetary
allocation to tertiary education.
Creating an endowment or income stream large enough to support new loan
applications from Student Loans Bureau. This could be done by placing a portion
of the tertiary allocation in the SLB‟s loan pool at concessionary rates (1 to 2%) to
be paid back on 30 year terms.
Creating a state-backed saving instrument for parents to start putting aside for
the higher education of their children.
As part of the review of education: If a student's loan debt is high but their income is
modest, they may qualify for the Income-Based Repayment Plan. A plan that ensures that
students who are willing to pay but have no job are not embarrassed because of their
poverty.
6.
There must be consensus around the urgency of school improvement. Too many
schools are still failing our students, and there is a reluctance to act decisively to fix
the problem. There is now a wealth of data collected by the National Education
Inspectorate to objectively classify the performance of schools. We started work on a