


 1 / 43


Methodology for Gleaner Analysis of 2015 GSAT Scores
The Ministry of Education provided the 2015 GSAT scores to Johnson Survey Research for 1008
educational institutions and entities.
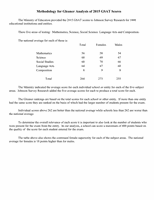
There five areas of testing: Mathematics, Science, Social Science. Language Arts and Composition.
The national average for each of these is:
Total
Females Males
Mathematics
56
58
54
Science
68
69
67
Social Studies
68
70
66
Language Arts
64
67
60
Composition
8
9
8
Total
264
273
255
The Ministry indicated the average score for each individual school or entity for each of the five subject
areas. Johnson Survey Research added the five average scores for each to produce a total score for each.
The Gleaner rankings are based on the total scores for each school or other entity. If more than one entity
had the same score they are ranked on the basis of which had the larger number of students present for the exam.
Individual scores above 262 are better than the national average while schools less than 262 are worse than
the national average.
To determine the overall relevance of each score it is important to also look at the number of students who
were present for the exam from the entity. In our analysis, a school can score a maximum of 400 points based on
the quality of the score for each student entered for the exam.
The table above also shows the continued female superiority for each of the subject areas. The national
average for females is 18 points higher than for males.